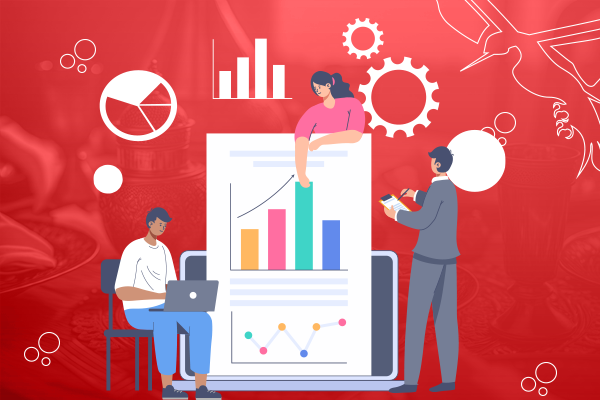
Building advanced financial and accounting reports is essential to decision-making and performance analysis for companies and institutions. Using the tools of the Phenix Systems, you can access a wide range of functions and tools that facilitate the preparation of advanced reports. When financial data is integrated with graphical tools, the advanced systems in Phenix can be used to analyze results more comprehensively and easily understand key trends.
These tools come with a wide range of features such as the ability to create aggregate, pivot, and custom reports tailored to the company's needs, in addition to big data analysis capabilities effective data linkage, and the generation of dynamic charts. This is to enhance understanding of financial performance and effectively support strategic decision-making.
What are advanced financial and accounting reports?
Reports refer to the documents and data provided by the accounting software for analyzing and evaluating the financial position of a company or institution. Reports typically present various financial data such as financial statements (balance sheet, income statement, etc.), financial and accounting analysis reports, cash flow reports, and others.
Reports are an essential part of the Phenix accounting program, they are generated based on the data entered into the system. These reports aim to provide accurate and comprehensive information about the financial performance of the company and assist in making strategic and executive financial decisions through these reports.
Users of the Phenix accounting system can track income, expenses, profits, and losses, and analyze financial trends, and they can provide reports to internal parties such as the work team and manager, and external parties such as investors and financial institutions. Therefore, these reports contribute to effective financial management, achieving transparency, and ensuring compliance with accounting and tax standards.
What is the importance of providing advanced and updated financial and accounting reports regularly to shareholders and investors?
The provision of advanced and regular financial and accounting reports to shareholders and investors offers necessary information for making decisions on various levels, including:
-
Transparency and Confidence:
Advanced and updated financial and accounting reports can provide high levels of transparency and supply accurate information to shareholders and investors regarding the company's performance and current financial position. This helps to build trust, provide reassurance, and increase the level of transparency in the relationship between the company and its investors.
-
Strategic Decision Making:
Reports provide shareholders and investors with the necessary information to make the right investment decisions, which may help in attracting potential investors and encouraging current shareholders to stay invested.
-
Performance Evaluation:
Evaluating the company's performance helps decision-makers determine if financial and strategic plans are being effectively executed, and whether the company is capable of achieving the expected returns.
-
Encouraging Investment:
Reports can motivate investors to increase their investments or attract new investors, as investors feel pleased and confident when they are informed about the current financial situation and future indicators of the company.
How can you create a financial reporting system in the Phenix accounting program?
In the Phenix accounting program, you can create custom reports and tailor them to your company's needs. These reports can be flexible and customized by including the specific data and information you want to analyze and present. Here are some types and styles of customized reports you can create in the Phenix accounting program:
These are just some examples of the types of customized reports that can be created in the Phenix accounting program, where you can tailor these reports precisely to meet your specific business needs and understand your financial information in detail.
-
First: Aggregate Reports
These reports consolidate financial data from multiple sources to provide a comprehensive overview of the company's overall financial status. These reports help in gaining a complete picture of the financial performance at the company.
-
Second: Pivot Reports
These reports can provide you with a pivot view of your financial data through advanced search options, allowing for analysis of data from multiple perspectives such as time, type, revenues, expenses, branches, and others. These reports enable you to understand trends and patterns in financial data and the company's financial performance.
-
Third: Graphical Planning Reports
These reports utilize charts and graphs to visually represent financial data in an easily understandable manner. They include chart types such as bar charts and pie charts, helping to analyze data and monitor trends and changes over time in an easy and visual way.
-
Fourth: Dashboard Reports
You can add and display customized reports that you want to monitor regularly. These customized reports help you quickly access important financial information and track the company's performance.
What are the benefits of building advanced financial and accounting reports using Phenix system tools in the process of making financial decisions for companies?
Building advanced financial reports can have many benefits, including:
-
Pre-built reports for clients:
Financial reports can be tailored for clients based on the nature of their business and their specific needs.
-
Independent authorization for each report:
The independent authorization for each report allows direct access to the required information without unwanted interference or modifications.
-
Customization of reports according to needs:
Reports can be customized with all variables and columns according to user requirements, aiding in making informed decisions.
-
Report performance speed:
Instead of traditional methods of extracting and compiling reports, building financial reports is characterized by speed and efficiency.
-
Hierarchical capability:
Users can build new customized reports based on pre-existing custom reports, providing opportunities to create a wide range of new reports according to individual needs.
What is the relevance of the application software used to prepare financial and accounting reports?
The reports generated by Phenix system tools assist in the analysis and utilization of information contained in financial and managerial reports to make decisions and achieve objectives. When we talk about report application, we mean effectively using the information in the reports for making strategic decisions and planning for the future.
The application of Phenix system tools involves the manager reviewing reports, and analyzing the data and numbers presented. Report application aims to maximize the benefit of the information in the reports to support decision-making processes and enhance the overall performance of the company.
Frequently Asked Questions (FAQ)
- How can financial and accounting data be visually presented using graphs and charts?
Financial and accounting data can be visually presented using various types of graphs such as line charts and pie charts to illustrate financial data. Visual presentation can be enhanced by selecting suitable colors and visual elements that contribute to better clarity of the data, and including titles and labels to explain the information.
_ How can I customize data reports to meet the specific needs of my company?
To tailor data reports to meet the specific needs of your company, you should first understand the company's needs and requirements for financial and accounting reports by interacting with various departments and understanding what they require in terms of data and reports. You can then identify the key performance indicators you want to include in the reports.
After that, you can use data analysis tools from the Phenix system to gather data from various sources and create customized reports that suit your company's specific needs. This includes selecting appropriate graphs and charts, formatting colors, and presenting data in a suitable style.
The reports should also include detailed interpretation and analysis of the data to ensure a proper understanding. It may be necessary to present the reports regularly to meet the requirements of management and other teams in the company, and to adapt the content and format based on feedback and continuous improvement.
_ How can aggregated data and charts be used to make better decisions at the managerial and executive level?
Aggregated data and charts can be used to make better decisions at the managerial and executive levels by providing specific and powerful insights into the company's financial performance and core operations. By visually displaying trends and key information, these tools help company leaders quickly understand the current situation and make appropriate decisions to achieve the company's goals.
With these tools, managers can easily use financial data and charts to understand patterns and trends behind the company's performance and make the best strategic decisions to achieve the company's objectives.
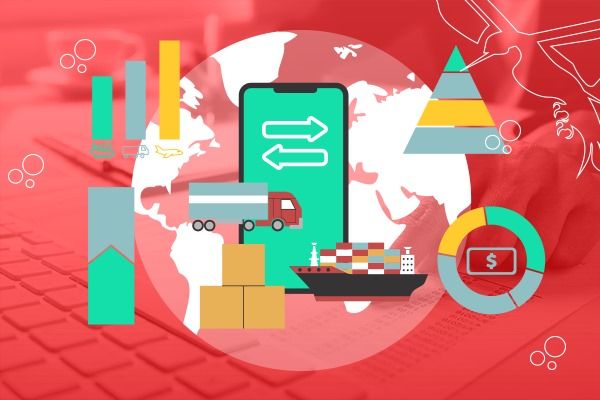
_What are the tools that can effectively integrate data from multiple sources?
Integration with the Phenix accounting software can be achieved using data analysis tools such as Microsoft Power BI to effectively integrate financial data from multiple sources. These tools provide powerful capabilities for importing data from diverse sources such as databases, Excel files, ready-made systems, and big data packages. They also offer user-friendly interfaces for defining, transforming, and merging data in a flexible and efficient manner.
With these tools, you can establish connections with different financial data sources and easily integrate them to create comprehensive financial reports. Moreover, these tools allow you to comprehensively analyze and visualize financial data, including creating clear and easy-to-understand charts and interactive reports.
_ How can complex financial reports be transformed into easily understandable formats for internal and external stakeholders?
Complex financial reports can be transformed into easy-to-understand formats by using visual charts and readable diagrams. When financial data is presented visually and in a simplified manner, non-financial experts can understand it more easily. Key performance indicators (KPIs) and monthly management reports can also be utilized to provide a quick overview of the company's financial performance in an easily understandable manner.
_ Does the software support tax reports and other financial reports according to company or regulatory requirements?
Yes, the Phenix accounting software is licensed and accredited by government tax authorities. It can provide tax reports and other financial reports according to company or regulatory requirements. Additionally, you can modify accounting templates and configure reports to suit the specific needs of your company.
_ How can I access required tax reports such as Value-Added Tax (VAT)?
The Phenix accounting software has a dedicated module for tax report preparation. You can easily generate the required reports by accessing the tax module, specifying the required period, selecting the type of report such as VAT, and then generating, reviewing, printing, or saving the report in PDF or Excel format as per your preference. This process provides ease of access to the required tax reports and ensures organization.
_Can I export reports to different formats to share them with clients or partners?
Yes, you can export reports from the Phenix accounting software to various formats such as Excel or PDF in order to share them with clients or partners. The software typically enables you to export reports with ease to these formats with just one click, making it easier for you to share necessary information with external parties. This feature helps simplify the communication process and provides convenient and efficient access to financial information.
_ How can data reports and charts be securely retained and efficiently managed?
Databases and specialized software can be used to securely store and manage data, with regular backups to ensure data loss prevention. Additionally, authentication and access control systems can be employed to ensure that each user has access to the appropriate data according to their permissions.


Comments (0)